Market Outlook
February 28, 2017
Market Cues
Domestic Indices
Chg (%)
(Pts)
(Close)
Indian markets are likely to open flat with positive bias tracking the SGX Nifty.
BSE Sensex
(0.3)
(80)
28,813
US stocks advanced slightly higher during Monday’s session as housing and steel
Nifty
(0.5)
(43)
8,897
stocks moved higher. The NYSE Steel Index and the Philadelphia Housing Sector
Mid Cap
0.0
2
13,534
Index climbed by 1.7 and 1.6 percent, respectively. The Commerce Department
Small Cap
0.2
22
13,610
released a report showing a rebound in durable goods orders. Durable goods
orders increased by 1.8 percent in January, against expectations of an increase of
Bankex
(1.4)
(331)
23,494
1.7 percent.
UK stocks closed flat as the pound closed near its two-week low. Persimmon
Global Indices
Chg (%)
(Pts)
(Close)
advanced 0.25 percent after the homebuilder reported a 23 percent rise in 2016
Dow Jones
0.1
16
20,837
pretax profit and reported good prospects for 2017. Associated British Foods slid
Nasdaq
0.3
17
5,862
0.92 percent after the retail conglomerate maintained its earnings guidance. In
FTSE
0.1
9
7,253
economic data, demand in the services sector picked up a little in the three months
Nikkei
(0.9)
(176)
19,107
to February, according to a survey by the Confederation of British Industries.
Hang Seng
(0.2)
(41)
23,925
The Indian indices closed down on Monday breaking a six-day winning streak due to
Shanghai Com
(0.8)
(25)
3,229
weakness in Asian and European markets. The Infra and bank indices both closed
down 1.26 percent while the energy index gained 1.31 percent. Among the large
caps, Reliance Industries continued its rally and closed up 4.75 percent while Idea
Advances / Declines
BSE
NSE
Cellular was the biggest loser as it closed down 4.22 percent.
Advances
1,279
707
Declines
1,543
965
News Analysis
Unchanged
229
74
Lupin inks pact to sell antidepressant drug
SAIL to increase manufacturing at new facilities
Volumes (` Cr)
Detailed analysis on Pg2
BSE
3,472
Investor’s Ready Reckoner
NSE
23,915
Key Domestic & Global Indicators
Stock Watch: Latest investment recommendations on 150+ stocks
Net Inflows (` Cr)
Net
Mtd
Ytd
Refer Pg5 onwards
FII
688
9,596
9,550
MFs
(31)
(54)
5,162
Top Picks
CMP
Target
Upside
Company
Sector
Rating
(`)
(`)
(%)
Top Gainers
Price (`)
Chg (%)
Amara Raja Batteries Auto & Auto Ancillary
Buy
860
1,009
17.4
Jpassociat
16
9.7
HCL Tech
IT
Buy
841
1,000
19.0
Power Grid Corp.
Power
Buy
193
223
15.6
Escorts
453
7.8
Navkar Corp.
Others
Buy
163
265
63.0
Raymond
602
7.8
KEI Industries
Others
Buy
175
207
18.5
Wockpharma
760
7.7
More Top Picks on Pg3
Deltacorp
146
6.7
Key Upcoming Events
Previous
Consensus
Top Losers
Price (`)
Chg (%)
Date
Region
Event Description
Reading
Expectations
J&Kbank
73
(5.1)
Feb 28 US
Consumer Confidence
111.80
111.00
Idea
115
(4.2)
Feb 28 Germany PMI Manufacturing
57.00
57.00
Cholafin
973
(4.0)
Mar 01 US
GDP Qoq (Annualised)
1.90
2.10
Mar 01 Germany Unemployment change (000's)
(26.00)
--
Gppl
151
(3.8)
Mar 01 UK
PMI Manufacturing
55.90
--
Axisbank
509
(3.6)
More Events on Pg4
As on February 27, 2017
Market Outlook
February 28, 2017
News Analysis
Lupin inks pact to sell antidepressant drug
has entered into an agreement with Astellas Pharma Inc providing Kyowa the
of quetiapine fumarate in Japan. Astellas has submitted a new drug
application (NDA) with the Ministry of Health, Labour and Welfare in Japan for
extended-release tablets of quetiapine fumarate for the indication of
improvement of depressive symptoms associated with bipolar disorder.
Following Kyowa’s recent acquisition of long-listed products from Shionogi &
Co., Ltd., the Astellas agreement reinforces Kyowa’s transition toward a hybrid
pharmaceutical specialty care company and bolsters its leadership in the CNS
space in Japan. We maintain our Buy recommendation with a price target of
`1,809.
SAIL to increase manufacturing at new facilities
SAIL plans to ramp up production at its new facilities including at Burnpur, Bokaro
and Rourkela. The company will also add new products to suit customer needs.
The company would be emphasizing on producing more varieties of steel to meet
the diverse requirements of steel users. Currently, SAIL has a diverse product
basket with 500 grades and 5,000 dimensions. The focus will also be on
increased last mile value addition to enable end users to significantly reduce
processing at their end.
This value addition is proposed at locations both inside and outside the steel
plants. The company has made it a focus to further streamline processes and
services to make them more customer-centric.
Economic and Political News
Railways assures Central Govt. that it will meet its electrification targets for
2016-17
Railways partners with India Post for parcel business
Third pay revision committee for central public sector enterprises (CPSEs)
recommends minimum pay of `30,000 per month for executives
Corporate News
HSIL sets aside `300cr to invest in consumer products
Entertainment Network India Limited (ENIL) picks up 21 frequencies during
2nd batch of phase 3 FM radio auction for `51cr
Cadila Healthcare announces plans to acquire more US pharma companies
to help build speciality drug portfolio
Bharti Airtel removes roaming charges for outgoing and incoming calls, SMS
and data usage within India
Market Outlook
February 28, 2017
Top Picks
Large Cap
M
arket Cap
CM
P
T
arget
Upsid
e
Company
Rationale
(` Cr)
(`)
(`)
(%)
To outpace battery industry growth due to better
Amara Raja Batteries
14,684
860
1,009
17.4
technological products leading to market share gains in both
the automotive OEM and replacement segments.
The stock is trading at attractive valuations and is factoring
HCL Tech
1,18,611
841
1,000
19.0
all the bad news.
Back on the growth trend, expect a long term growth of 14%
Infosys
2,32,623
1,013
1,249
23.3
to be a US$20bn in FY2020.
Strong order backlog and improvement in execution would
Larsen & Toubro
1,36,983
1,468
1,634
11.3
trigger the growth for the L&T
One of the largest pharma companies with strong
Lupin
66,090
1,464
1,809
23.6
international presence. It has a rich pipeline of ANDAs which
is also one of the largest among the generic companies.
Going forward, we expect the company to report strong
Power Grid Corporation
1,00,891
193
223
15.6
top-line CAGR of ~16% and bottom-line CAGR of ~19%
over FY16-18 on back of strong capitalization guidance
Source: Company, Angel Research
Mid Cap
M
arket Cap
CM
P
T
arget
Upsid
e
Company
Rationale
(` Cr)
(`)
(`)
(%)
We expect the company would report strong profitability
Asian Granito
844
281
351
25.1
owing to better product mix, higher B2C sales and
amalgamation synergy.
Among the top 4 players in the consumer durables segment.
Bajaj Electricals
2,601
257
295
14.8
Improved profitability backed by turn around in E&P segment.
Strong order book lends earnings visibility.
Favourable outlook for the AC industry to augur well for
Cooling products business which is out pacing the market
Blue Star
5,316
556
634
14.0
growth. EMPPAC division's profitability to improve once
operating environment turns around.
With a focus on the low and medium income (LMI) consumer
Dewan Housing Finance
10,394
332
350
5.4
segment, the company has increased its presence in tier-II &
III cities where the growth opportunity is immense.
Strong loan growth backed by diversified loan portfolio and
Equitas Holdings
5,966
177
235
32.9
adequate CAR. ROE & ROA likely to remain decent as risk of
dilution remains low. Attractive valuations considering growth.
Economic recovery to have favourable impact on advertising
& circulation revenue growth. Further, the acquisition of a
Jagran Prakashan
6,110
187
225
20.4
radio business (Radio City) would also boost the company's
revenue growth.
High order book execution in EPC segment, rising B2C sales
KEI Industries
1,359
175
207
18.5
and higher exports to boost the revenues and profitability
Speedier execution and speedier sales, strong revenue visibilty
Mahindra Lifespace
1,421
346
522
50.8
in short-to-long run, attractive valuations
Higher growth in domestic branded sales and healthy export
Mirza International
1,093
91
107
17.8
to boost the profitability.
Massive capacity expansion along with rail advantage at ICD
Navkar Corporation
2,318
163
265
63.0
as well CFS augurs well for the company
Market leadership in Hindi news genre and no. 2 viewership
ranking in English news genre, exit from the radio business,
TV Today Network
1,555
261
385
47.7
and anticipated growth in ad spends by corporates to benefit
the stock.
Source: Company, Angel Research
Market Outlook
February 28, 2017
Key Upcoming Events
Global economic events release calendar
Bloomberg Data
Date
Time
Country
Event Description
Unit
Period
Last Reported
Estimated
Feb 28, 2017
8:30 PM US
Consumer Confidence
S.A./ 1985=100 Feb
111.80
111.00
2:25 PM Germany PMI Manufacturing
Value
Feb F
57.00
57.00
Mar 01, 2017
7:00 PM US
GDP Qoq (Annualised)
% Change
4Q S
1.90
2.10
2:25 PM Germany Unemployment change (000's)
Thousands
Feb
-26.00
-10.00
7:00 PM US
Initial Jobless claims
Thousands
Feb 25
244.00
245.00
3:00 PM UK
PMI Manufacturing
Value
Feb
55.90
55.80
Mar 02, 2017
6:30 AM China
PMI Manufacturing
Value
Feb
51.30
51.20
Mar 03, 2017
2:25 PM Germany PMI Services
Value
Feb F
54.40
54.40
Mar 07, 2017
3:30 PM Euro Zone Euro-Zone GDP s.a. (QoQ)
% Change
4Q F
0.40
Mar 08, 2017
China
Exports YoY%
% Change
Feb
7.90
Mar 09, 2017
7:00 AM China
Consumer Price Index (YoY)
% Change
Feb
2.50
6:15 PM Euro Zone ECB announces interest rates
%
Mar 9
0.00
Mar 10, 2017
India
Imports YoY%
% Change
Feb
10.70
India
Exports YoY%
% Change
Feb
4.30
3:00 PM UK
Industrial Production (YoY)
% Change
Jan
4.30
5:30 PM India
Industrial Production YoY
% Change
Jan
-0.40
7:00 PM US
Unnemployment rate
%
Feb
4.80
4.70
7:00 PM US
Change in Nonfarm payrolls
Thousands
Feb
227.00
175.00
Mar 14, 2017 12:00 PM India
Monthly Wholesale Prices YoY%
% Change
Feb
5.25
US
Producer Price Index (mom)
% Change
Feb
1.10
Mar 15, 2017
3:00 PM UK
Jobless claims change
% Change
Feb
(42.40)
6:00 PM US
Consumer price index (mom)
% Change
Feb
0.60
0.00
Mar
11:30 PM US
FOMC rate decision
0.75
0.75
%
15
Mar 16, 2017
3:30 PM Euro Zone Euro-Zone CPI (YoY)
%
Feb F
1.80
6:00 PM US
Housing Starts
Thousands
Feb
######
1250.00
6:00 PM US
Building permits
Thousands
Feb
######
1250.00
6:45 PM US
Industrial Production
%
Feb
(0.25)
0.40
Source: Bloomberg, Angel Research
Market Outlook
February 28, 2017
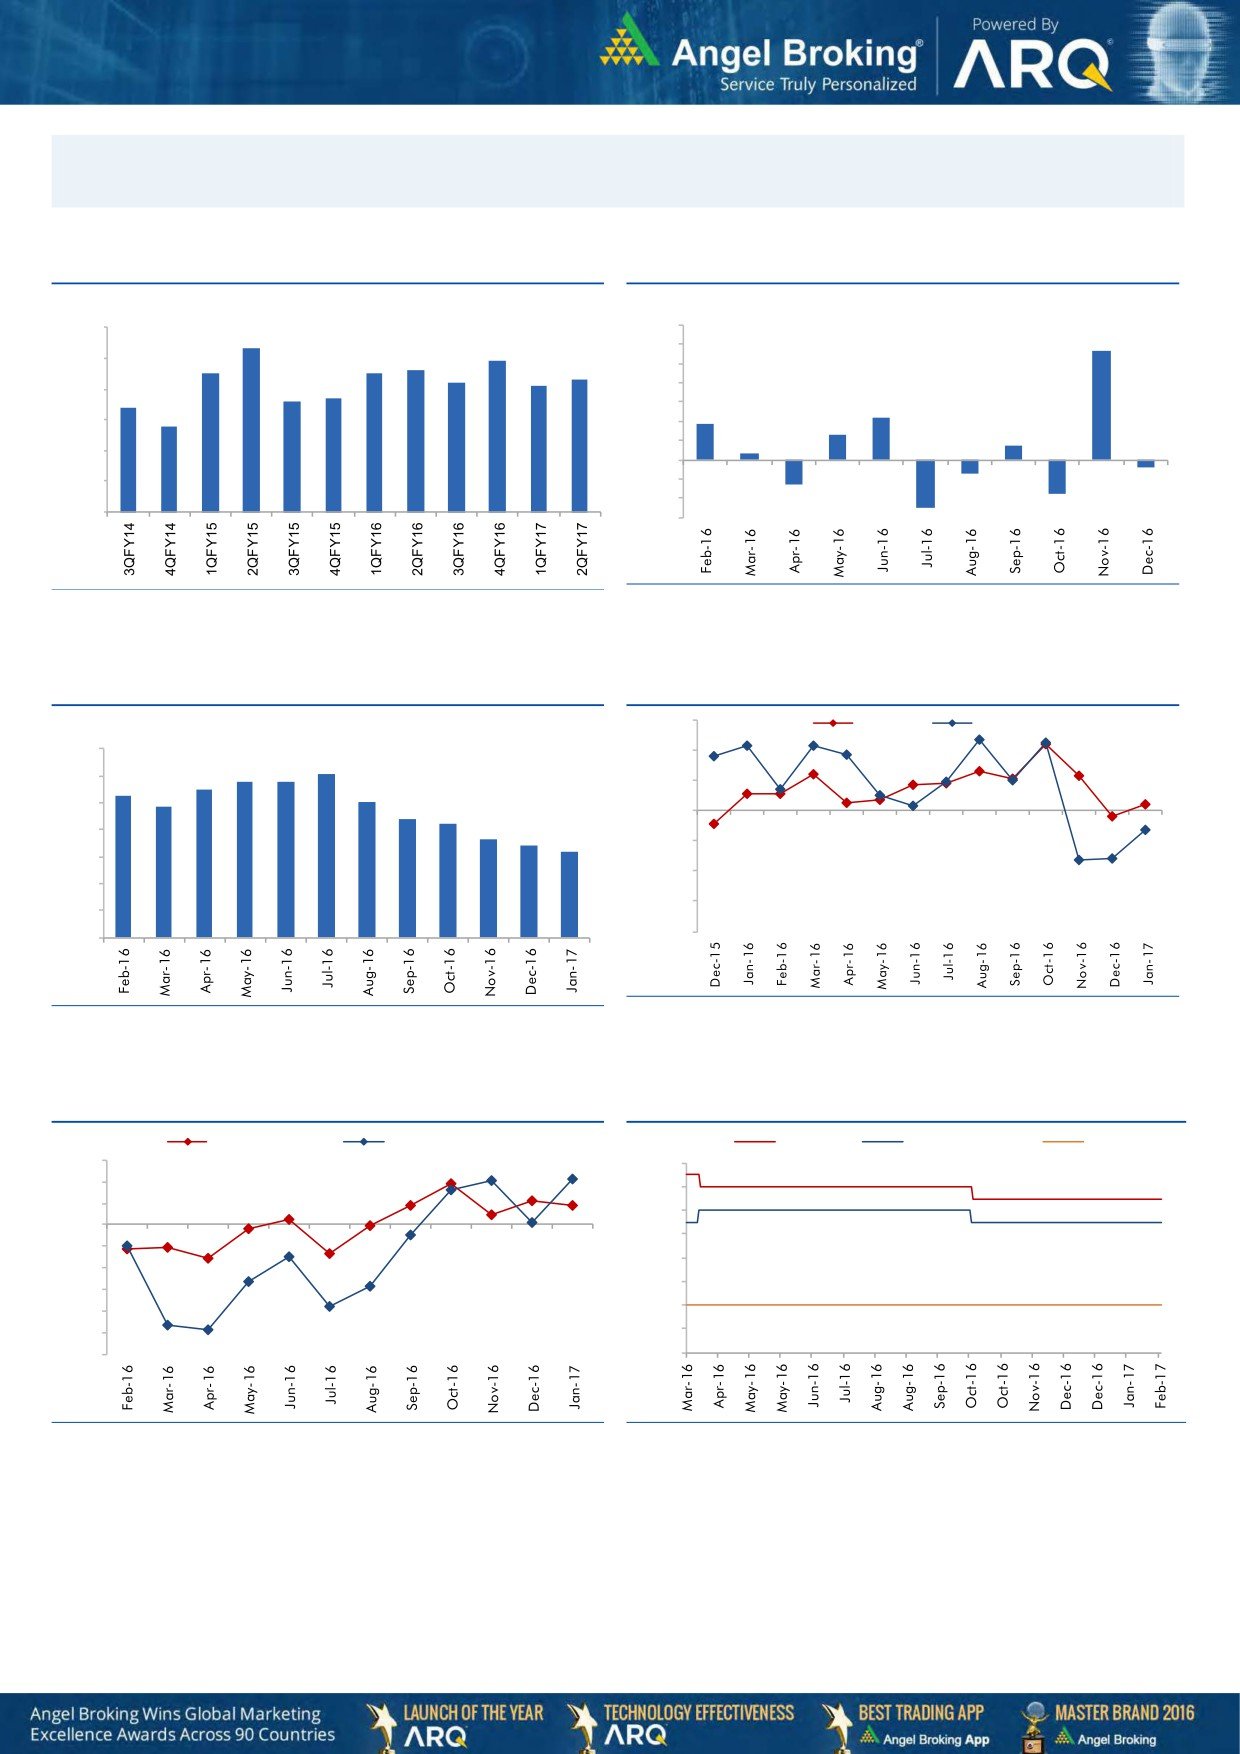
Macro watch
Exhibit 1: Quarterly GDP trends
Exhibit 2: IIP trends
(%)
(%)
9.0
7.0
8.3
5.7
7.9
6.0
8.0
7.5
7.5
7.6
7.3
5.0
7.2
7.1
6.6
6.7
4.0
7.0
6.4
3.0
2.2
5.8
1.9
6.0
2.0
1.3
0.7
1.0
0.3
5.0
-
4.0
(1.0)
(0.7)
(0.4)
(2.0)
(1.3)
3.0
(1.8)
(3.0)
(2.5)
Source: MOSPI, Angel Research
Source: CSO, Angel Research
Exhibit 3: Monthly CPI inflation trends
Exhibit 4: Manufacturing and services PMI
56.0
Mfg. PMI
Services PMI
(%)
7.0
54.0
6.1
5.8
5.8
6.0
5.5
5.3
5.1
52.0
4.8
5.0
4.4
4.2
50.0
3.6
4.0
3.4
3.2
48.0
3.0
46.0
2.0
44.0
1.0
42.0
-
Source: Market, Angel Research; Note: Level above 50 indicates expansion
Source: MOSPI, Angel Research
Exhibit 5: Exports and imports growth trends
Exhibit 6: Key policy rates
(%)
Exports yoy growth
Imports yoy growth
(%)
Repo rate
Reverse Repo rate
CRR
15.0
7.00
10.0
6.50
5.0
6.00
0.0
5.50
(5.0)
5.00
(10.0)
4.50
(15.0)
4.00
(20.0)
(25.0)
3.50
(30.0)
3.00
Source: Bloomberg, Angel Research
Source: RBI, Angel Research
Market Outlook
February 28, 2017
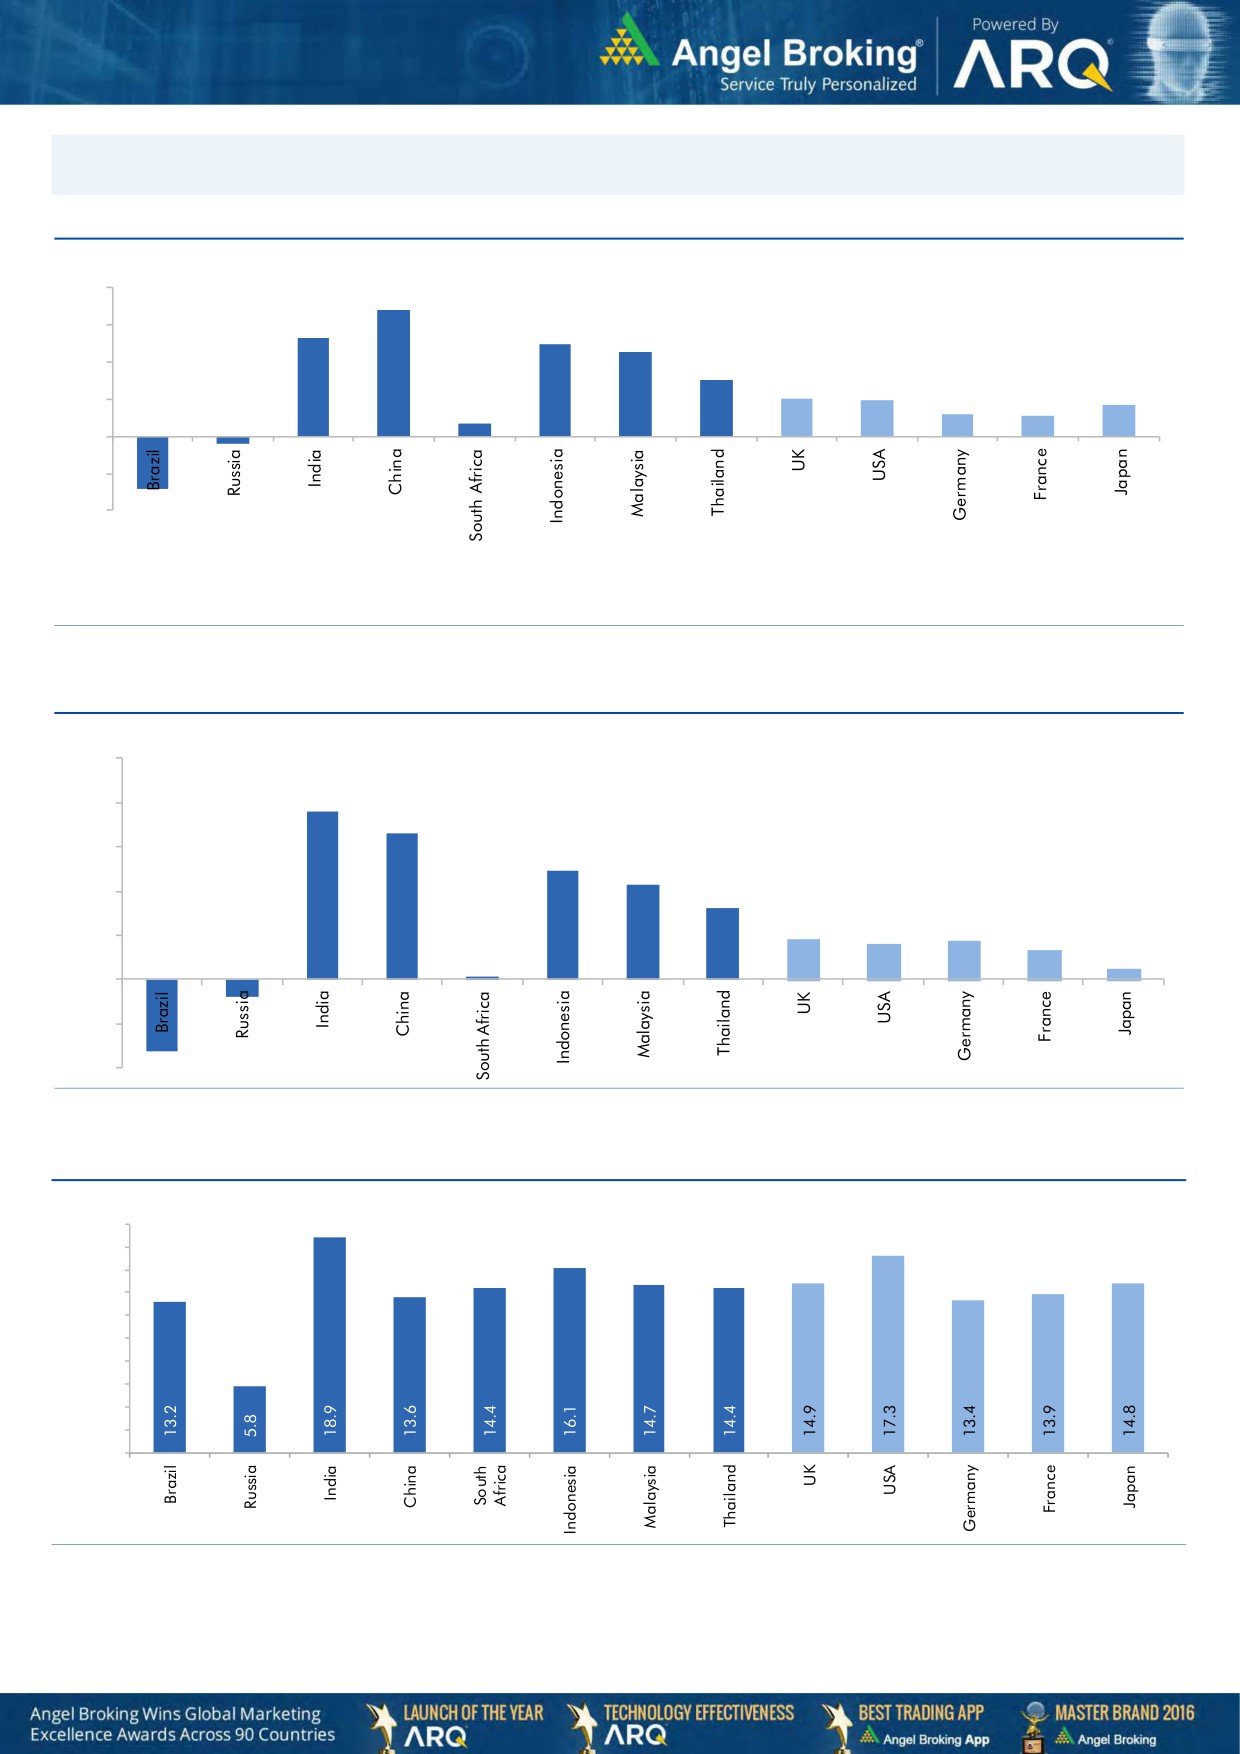
Global watch
Exhibit 1: Latest quarterly GDP Growth (%, yoy) across select developing and developed countries
(%)
8.0
6.8
0.7
5.3
6.0
4.9
4.5
4.0
3.0
2.0
1.9
1.2
1.7
1.1
2.0
-
(2.0)
(0.4)
(4.0)
(2.9)
Source: Bloomberg, Angel Research
Exhibit 2: 2016 GDP Growth projection by IMF (%, yoy) across select developing and developed countries
(%)
10.0
7.6
8.0
6.6
6.0
4.9
4.3
4.0
3.2
1.8
1.7
1.6
2.0
1.3
(0.8)
0.5
(3.3)
0.1
-
(2.0)
(4.0)
Source: IMF, Angel Research
Exhibit 3: One year forward P-E ratio across select developing and developed countries
(x)
20.0
18.0
16.0
14.0
12.0
10.0
8.0
6.0
4.0
2.0
-
Source: IMF, Angel Research
Market Outlook
February 28, 2017
Exhibit 4: Relative performance of indices across globe
Returns (%)
Country
Name of index
Closing price
1M
3M
1YR
Brazil
Bovespa
66,662
1.2
8.6
60.3
Russia
Micex
2,056
(5.5)
(2.0)
11.5
India
Nifty
8,897
5.0
9.6
23.4
China
Shanghai Composite
3,229
3.4
(0.6)
12.8
South Africa
Top 40
44,463
(4.4)
0.9
4.7
Mexico
Mexbol
47,349
(1.9)
4.4
7.1
Indonesia
LQ45
894
1.1
2.4
8.9
Malaysia
KLCI
1,694
1.3
4.1
1.1
Thailand
SET 50
976
(1.5)
5.5
20.1
USA
Dow Jones
20,837
3.8
9.5
26.2
UK
FTSE
7,253
1.3
6.2
17.9
Japan
Nikkei
19,107
(1.5)
5.2
18.0
Germany
DAX
11,823
(0.2)
11.7
20.3
France
CAC
4,845
(0.5)
7.4
10.0
Source: Bloomberg, Angel Research
Stock Watch
February 28, 2017
Company Name
Reco
CMP
Target
Mkt Cap
Sales ( Čcr )
OPM(%)
EPS (Č)
PER(x)
P/BV(x)
RoE(%)
EV/Sales(x)
(Č)
Price ( Č)
( Č cr )
FY17E FY18E
FY17E
FY18E
FY17E
FY18E
FY17E
FY18E
FY17E
FY18E
FY17E
FY18E
FY17E
FY18E
Agri / Agri Chemical
Rallis
Neutral
236
-
4,591
1,937
2,164
13.3
14.3
9.0
11.0
26.2
21.5
4.6
4.0
18.4
19.8
2.4
2.1
United Phosphorus
Neutral
715
-
36,234
15,176
17,604
18.5
18.5
37.4
44.6
19.1
16.0
3.8
3.1
21.4
21.2
2.5
2.1
Auto & Auto Ancillary
Ashok Leyland
Buy
89
111
25,399
20,021
21,915
11.6
11.9
4.5
5.3
19.8
16.8
4.0
3.6
20.6
21.5
1.2
1.1
Bajaj Auto
Neutral
2,802
-
81,076
25,093
27,891
19.5
19.2
143.9
162.5
19.5
17.2
5.5
4.7
30.3
29.4
3.0
2.6
Bharat Forge
Neutral
1,056
-
24,589
7,726
8,713
20.5
21.2
35.3
42.7
29.9
24.7
5.5
5.0
18.9
20.1
3.2
2.8
Eicher Motors
Neutral
24,337
-
66,223
16,583
20,447
17.5
18.0
598.0
745.2
40.7
32.7
13.9
10.6
41.2
38.3
3.8
3.0
Gabriel India
Buy
112
130
1,611
1,544
1,715
9.0
9.3
5.4
6.3
20.8
17.8
3.9
3.5
18.9
19.5
1.0
0.9
Hero Motocorp
Accumulate
3,168
3,446
63,271
28,083
30,096
15.3
15.7
171.8
187.0
18.4
16.9
6.4
5.4
30.1
27.9
2.1
1.9
Jamna Auto Industries Neutral
209
-
1,668
1,486
1,620
9.8
9.9
15.0
17.2
14.0
12.2
3.1
2.6
21.8
21.3
1.2
1.1
L G Balakrishnan & Bros Neutral
554
-
869
1,302
1,432
11.6
11.9
43.7
53.0
12.7
10.5
1.8
1.6
13.8
14.2
0.8
0.7
Mahindra and Mahindra Neutral
1,296
-
80,497
46,534
53,077
11.6
11.7
67.3
78.1
19.3
16.6
3.1
2.7
15.4
15.8
1.7
1.5
Maruti
Accumulate
5,952
6,560
179,784
67,822
83,288
16.0
16.4
253.8
312.4
23.5
19.1
5.4
4.4
23.0
22.9
2.3
1.8
Minda Industries
Neutral
412
-
3,270
2,728
3,042
9.0
9.1
68.2
86.2
6.0
4.8
1.4
1.1
23.8
24.3
1.3
1.1
Motherson Sumi
Neutral
345
-
48,431
45,896
53,687
7.8
8.3
13.0
16.1
26.5
21.4
8.5
6.8
34.7
35.4
1.1
0.9
Rane Brake Lining
Neutral
968
-
766
511
562
11.3
11.5
28.1
30.9
34.5
31.3
5.3
4.8
15.3
15.0
1.6
1.5
Setco Automotive
Neutral
35
-
468
741
837
13.0
13.0
15.2
17.0
2.3
2.1
0.4
0.3
15.8
16.3
1.0
0.9
Tata Motors
Neutral
457
-
132,038
300,209
338,549
8.9
8.4
42.7
54.3
10.7
8.4
1.7
1.5
15.6
17.2
0.6
0.5
TVS Motor
Neutral
435
-
20,657
13,390
15,948
6.9
7.1
12.8
16.5
34.1
26.3
8.5
6.7
26.3
27.2
1.6
1.3
Amara Raja Batteries
Buy
860
1,009
14,684
5,305
6,100
16.0
16.3
28.4
34.0
30.3
25.3
5.8
4.9
19.3
19.3
2.8
2.4
Exide Industries
Neutral
208
-
17,689
7,439
8,307
15.0
15.0
8.1
9.3
25.7
22.4
3.6
3.2
14.3
16.7
2.0
1.8
Apollo Tyres
Buy
185
235
9,399
12,877
14,504
14.3
13.9
21.4
23.0
8.6
8.0
1.3
1.2
16.4
15.2
0.9
0.8
Ceat
Buy
1,169
1,450
4,728
7,524
8,624
13.0
12.7
131.1
144.3
8.9
8.1
1.6
1.4
19.8
18.6
0.7
0.6
JK Tyres
Neutral
122
-
2,765
7,455
8,056
15.0
15.0
21.8
24.5
5.6
5.0
1.2
1.0
22.8
21.3
0.5
0.4
Swaraj Engines
Neutral
1,379
-
1,712
660
810
15.2
16.4
54.5
72.8
25.3
18.9
7.9
7.2
31.5
39.2
2.4
1.9
Subros
Neutral
195
-
1,170
1,488
1,681
11.7
11.9
6.4
7.2
30.5
27.2
3.2
2.9
10.8
11.4
1.0
0.9
Indag Rubber
Neutral
174
-
455
286
326
19.8
16.8
11.7
13.3
14.8
13.0
2.5
2.3
17.8
17.1
1.3
1.1
Capital Goods
ACE
Neutral
54
-
530
709
814
4.1
4.6
1.4
2.1
38.3
25.5
1.6
1.5
4.4
6.0
0.9
0.8
BEML
Neutral
1,345
-
5,599
3,451
4,055
6.3
9.2
31.4
57.9
42.8
23.2
2.6
2.3
6.3
10.9
1.7
1.5
Bharat Electronics
Neutral
1,508
-
33,684
8,137
9,169
16.8
17.2
58.7
62.5
25.7
24.1
4.0
3.5
44.6
46.3
3.1
2.8
Stock Watch
February 28, 2017
Company Name
Reco
CMP
Target
Mkt Cap
Sales ( Čcr )
OPM(%)
EPS (Č)
PER(x)
P/BV(x)
RoE(%)
EV/Sales(x)
(Č)
Price ( Č)
( Č cr )
FY17E
FY18E
FY17E
FY18E
FY17E
FY18E
FY17E
FY18E
FY17E
FY18E
FY17E
FY18E
FY17E
FY18E
Capital Goods
Voltas
Accumulate
364
407
12,039
6,511
7,514
7.9
8.7
12.9
16.3
28.2
22.3
5.1
4.5
16.7
18.5
1.6
1.4
BGR Energy
Neutral
136
-
981
16,567
33,848
6.0
5.6
7.8
5.9
17.4
23.1
1.0
1.0
4.7
4.2
0.2
0.1
BHEL
Neutral
153
-
37,448
28,797
34,742
-
2.8
2.3
6.9
66.5
22.2
1.1
1.1
1.3
4.8
1.0
0.7
Blue Star
Accumulate
556
634
5,316
4,283
5,077
5.9
7.3
14.9
22.1
37.4
25.1
7.3
6.1
20.4
26.4
1.3
1.1
Crompton Greaves
Neutral
69
-
4,343
5,777
6,120
5.9
7.0
3.3
4.5
21.0
15.4
0.9
0.9
4.4
5.9
0.7
0.6
Greaves Cotton
Neutral
161
-
3,939
1,755
1,881
16.8
16.9
7.8
8.5
20.7
19.0
4.1
3.8
20.6
20.9
1.9
1.8
Inox Wind
Neutral
175
-
3,878
5,605
6,267
15.7
16.4
24.8
30.0
7.1
5.8
2.0
1.4
25.9
24.4
0.7
0.6
KEC International
Neutral
163
-
4,191
9,294
10,186
7.9
8.1
9.9
11.9
16.5
13.7
2.4
2.1
15.6
16.3
0.7
0.6
KEI Industries
Buy
175
207
1,359
2,682
3,058
10.4
10.0
11.7
12.8
14.9
13.6
3.0
2.5
20.1
18.2
0.7
0.6
Thermax
Neutral
855
-
10,188
5,421
5,940
7.3
7.3
25.7
30.2
33.3
28.3
4.0
3.7
12.2
13.1
1.8
1.6
VATech Wabag
Buy
577
681
3,150
3,136
3,845
8.9
9.1
26.0
35.9
22.2
16.1
2.8
2.4
13.4
15.9
0.9
0.7
Cement
ACC
Neutral
1,418
-
26,637
11,225
13,172
13.2
16.9
44.5
75.5
31.9
18.8
3.0
2.8
11.2
14.2
2.4
2.0
Ambuja Cements
Neutral
230
-
45,630
9,350
10,979
18.2
22.5
5.8
9.5
39.6
24.2
3.3
3.0
10.2
12.5
4.9
4.2
India Cements
Neutral
165
-
5,053
4,364
4,997
18.5
19.2
7.9
11.3
20.8
14.6
1.5
1.5
8.0
8.5
1.9
1.7
JK Cement
Neutral
888
-
6,209
4,398
5,173
15.5
17.5
31.2
55.5
28.5
16.0
3.4
3.0
12.0
15.5
2.0
1.6
J K Lakshmi Cement
Neutral
403
-
4,747
2,913
3,412
14.5
19.5
7.5
22.5
53.8
17.9
3.3
2.8
12.5
18.0
2.2
1.9
Orient Cement
Neutral
152
-
3,122
2,114
2,558
18.5
20.5
8.1
11.3
18.8
13.5
2.8
2.3
9.0
14.0
2.1
1.6
UltraTech Cement
Neutral
3,753
-
103,014
25,768
30,385
21.0
23.5
111.0
160.0
33.8
23.5
4.3
3.8
13.5
15.8
4.1
3.4
Construction
ITNL
Neutral
100
-
3,286
8,946
10,017
31.0
31.6
8.1
9.1
12.3
11.0
0.5
0.5
4.2
5.0
3.7
3.4
KNR Constructions
Neutral
178
-
2,504
1,385
1,673
14.7
14.0
41.2
48.5
4.3
3.7
0.8
0.7
14.9
15.2
1.9
1.6
Larsen & Toubro
Accumulate
1,468
1,634
136,983
111,017
124,908
11.0
11.0
61.1
66.7
24.0
22.0
2.9
2.7
13.1
12.9
2.3
2.1
Gujarat Pipavav Port
Neutral
151
-
7,310
705
788
52.2
51.7
5.0
5.6
30.2
27.0
3.0
2.7
11.2
11.2
10.0
8.5
Nagarjuna Const.
Neutral
81
-
4,517
8,842
9,775
9.1
8.8
5.3
6.4
15.3
12.7
1.2
1.1
8.2
9.1
0.7
0.6
PNC Infratech
Buy
102
143
2,617
2,350
2,904
13.1
13.2
9.0
8.8
11.3
11.6
0.4
0.4
15.9
13.9
1.2
1.0
Simplex Infra
Neutral
298
-
1,473
6,829
7,954
10.5
10.5
31.4
37.4
9.5
8.0
1.0
0.9
9.9
13.4
0.6
0.5
Power Mech Projects
Neutral
438
-
644
1,801
2,219
12.7
14.6
72.1
113.9
6.1
3.8
1.1
0.9
16.8
11.9
0.4
0.3
Sadbhav Engineering
Accumulate
277
298
4,754
3,598
4,140
10.3
10.6
9.0
11.9
30.8
23.3
3.2
2.8
9.9
11.9
1.6
1.4
NBCC
Neutral
168
-
15,125
7,428
9,549
7.9
8.6
8.2
11.0
20.5
15.3
1.0
0.8
28.2
28.7
1.8
1.3
MEP Infra
Neutral
44
-
714
1,877
1,943
30.6
29.8
3.0
4.2
14.6
10.5
7.1
4.8
0.6
0.6
1.8
1.6
Stock Watch
February 28, 2017
Company Name
Reco
CMP
Target
Mkt Cap
Sales ( Čcr )
OPM(%)
EPS (Č)
PER(x)
P/BV(x)
RoE(%)
EV/Sales(x)
(Č)
Price ( Č)
( Č cr )
FY17E
FY18E
FY17E
FY18E
FY17E
FY18E
FY17E
FY18E
FY17E
FY18E
FY17E
FY18E
FY17E
FY18E
Construction
SIPL
Neutral
93
-
3,290
1,036
1,252
65.5
66.2
(8.4)
(5.6)
3.5
4.0
(22.8)
(15.9)
11.4
9.5
Engineers India
Neutral
147
-
9,933
1,725
1,935
16.0
19.1
11.4
13.9
12.9
10.6
1.8
1.7
13.4
15.3
4.7
4.2
Financials
Axis Bank
Accumulate
509
580
121,726
46,932
53,575
3.5
3.4
32.4
44.6
15.7
11.4
2.0
1.8
13.6
16.5
-
-
Bank of Baroda
Neutral
164
-
37,892
19,980
23,178
1.8
1.8
11.5
17.3
14.3
9.5
1.6
1.4
8.3
10.1
-
-
Canara Bank
Neutral
289
-
15,671
15,225
16,836
1.8
1.8
14.5
28.0
19.9
10.3
1.4
1.1
5.8
8.5
-
-
Can Fin Homes
Accumulate
1,935
2,128
5,152
420
526
3.5
3.5
86.5
107.8
22.4
18.0
4.8
3.9
23.6
24.1
-
-
Cholamandalam Inv. &
Buy
970
1,230
15,163
2,012
2,317
6.3
6.3
42.7
53.6
22.7
18.1
3.6
3.1
16.9
18.3
-
-
Fin. Co.
Dewan Housing Finance Accumulate
332
350
10,394
2,225
2,688
2.9
2.9
29.7
34.6
11.2
9.6
1.8
1.5
16.1
16.8
-
-
Equitas Holdings
Buy
177
235
5,966
939
1,281
11.7
11.5
5.8
8.2
30.5
21.6
2.6
2.3
10.9
11.5
-
-
Federal Bank
Neutral
83
-
14,357
8,259
8,995
3.0
3.0
4.3
5.6
19.4
14.9
1.6
1.5
8.5
10.1
-
-
HDFC
Neutral
1,378
-
218,462
11,475
13,450
3.4
3.4
45.3
52.5
30.4
26.2
5.9
5.2
20.2
20.5
-
-
HDFC Bank
Neutral
1,394
-
356,836
46,097
55,433
4.5
4.5
58.4
68.0
23.9
20.5
4.2
3.5
18.8
18.6
-
-
ICICI Bank
Accumulate
279
315
162,349
42,800
44,686
3.1
3.3
18.0
21.9
15.5
12.7
2.1
2.0
11.1
12.3
-
-
Lakshmi Vilas Bank
Accumulate
160
174
3,060
3,339
3,799
2.7
2.8
11.0
14.0
14.5
11.4
1.5
1.4
11.2
12.7
-
-
LIC Housing Finance
Accumulate
566
630
28,584
3,712
4,293
2.6
2.5
39.0
46.0
14.5
12.3
2.7
2.3
19.9
20.1
-
-
Punjab Natl.Bank
Neutral
139
-
29,653
23,532
23,595
2.3
2.4
6.8
12.6
20.5
11.1
3.2
2.3
3.3
6.5
-
-
RBL Bank
Neutral
468
-
17,300
1,783
2,309
2.6
2.6
12.7
16.4
36.8
28.5
4.0
3.6
12.8
13.3
-
-
South Ind.Bank
Neutral
20
-
2,731
6,435
7,578
2.5
2.5
2.7
3.1
7.5
6.5
1.0
0.8
10.1
11.2
-
-
St Bk of India
Neutral
268
-
213,810
88,650
98,335
2.6
2.6
13.5
18.8
19.9
14.3
1.9
1.7
7.0
8.5
-
-
Union Bank
Neutral
145
-
9,968
13,450
14,925
2.3
2.3
25.5
34.5
5.7
4.2
0.8
0.7
7.5
10.2
-
-
Yes Bank
Neutral
1,422
-
60,193
8,978
11,281
3.3
3.4
74.0
90.0
19.2
15.8
3.7
3.1
17.0
17.2
-
-
FMCG
Asian Paints
Neutral
1,002
-
96,068
17,128
18,978
16.8
16.4
19.1
20.7
52.4
48.4
18.2
17.2
34.8
35.5
5.5
5.0
Britannia
Accumulate
3,246
3,626
38,952
9,594
11,011
14.6
14.9
80.3
94.0
40.4
34.5
16.6
12.8
41.2
-
3.9
3.4
Colgate
Accumulate
893
995
24,288
4,605
5,149
23.4
23.4
23.8
26.9
37.5
33.2
20.8
16.2
64.8
66.8
5.2
4.6
Dabur India
Accumulate
272
304
47,940
8,315
9,405
19.8
20.7
8.1
9.2
33.6
29.6
9.4
7.8
31.6
31.0
5.4
4.8
GlaxoSmith Con*
Neutral
5,148
-
21,652
4,350
4,823
21.2
21.4
179.2
196.5
28.7
26.2
7.6
6.5
27.1
26.8
4.4
3.9
Godrej Consumer
Neutral
1,647
-
56,082
10,235
11,428
18.4
18.6
41.1
44.2
40.1
37.3
8.9
7.5
24.9
24.8
5.6
4.9
HUL
Neutral
867
-
187,534
35,252
38,495
17.8
17.8
20.7
22.4
42.0
38.7
40.1
34.4
95.6
88.9
5.2
4.7
ITC
Accumulate
264
284
320,668
40,059
44,439
38.3
39.2
9.0
10.1
29.4
26.1
8.2
7.2
27.8
27.5
7.5
6.8
Stock Watch
February 28, 2017
Company Name
Reco
CMP
Target
Mkt Cap
Sales ( Čcr )
OPM(%)
EPS (Č)
PER(x)
P/BV(x)
RoE(%)
EV/Sales(x)
(Č)
Price ( Č)
( Č cr )
FY17E FY18E
FY17E
FY18E
FY17E
FY18E
FY17E
FY18E
FY17E
FY18E
FY17E
FY18E
FY17E
FY18E
FMCG
Marico
Accumulate
276
300
35,627
6,430
7,349
18.8
19.5
6.4
7.7
43.1
35.9
13.0
11.0
33.2
32.5
5.4
4.6
Nestle*
Neutral
6,360
-
61,320
10,073
11,807
20.7
21.5
124.8
154.2
51.0
41.3
20.9
18.8
34.8
36.7
5.9
5.0
Tata Global
Neutral
139
-
8,766
8,675
9,088
9.8
9.8
7.4
8.2
18.8
16.9
2.1
2.0
7.9
8.1
0.9
0.9
Procter & Gamble
Neutral
7,100
-
23,047
2,939
3,342
23.2
23.0
146.2
163.7
48.6
43.4
108.7
104.3
25.3
23.5
7.4
6.4
Hygiene
IT
HCL Tech^
Buy
841
1,000
118,611
49,242
57,168
20.5
20.5
55.7
64.1
15.1
13.1
3.1
2.4
20.3
17.9
2.3
1.8
Infosys
Buy
1,013
1,249
232,623
68,350
77,326
27.0
27.0
62.5
69.4
16.2
14.6
3.5
3.2
21.3
21.6
2.8
2.5
TCS
Accumulate
2,489
2,700
490,420
119,025
133,308
27.6
27.6
131.2
145.5
19.0
17.1
6.2
5.7
32.4
33.1
3.9
3.4
Tech Mahindra
Buy
500
600
48,672
29,673
32,937
15.5
17.0
32.8
39.9
15.2
12.5
3.0
2.6
19.6
20.7
1.4
1.2
Wipro
Buy
489
583
118,919
55,440
60,430
18.1
18.1
36.1
38.9
13.6
12.6
2.4
2.2
19.0
17.6
1.9
1.6
Media
D B Corp
Neutral
380
-
6,992
2,297
2,590
27.4
28.2
21.0
23.4
18.1
16.3
4.2
3.7
23.7
23.1
2.8
2.5
HT Media
Neutral
84
-
1,949
2,693
2,991
12.6
12.9
7.9
9.0
10.6
9.3
0.9
0.8
7.8
8.3
0.3
0.2
Jagran Prakashan
Buy
187
225
6,110
2,355
2,635
28.0
28.0
10.8
12.5
17.3
15.0
3.8
3.2
21.7
21.7
2.6
2.3
Sun TV Network
Neutral
709
-
27,921
2,850
3,265
70.1
71.0
26.2
30.4
27.0
23.3
6.9
6.1
24.3
25.6
9.4
8.1
Hindustan Media
Neutral
278
-
2,038
1,016
1,138
24.3
25.2
27.3
30.1
10.2
9.2
1.9
1.7
16.2
15.8
1.3
1.2
Ventures
TV Today Network
Buy
261
385
1,555
637
743
27.5
27.5
18.4
21.4
14.2
12.2
2.5
2.1
17.4
17.2
2.0
1.7
Metals & Mining
Coal India
Neutral
330
-
204,845
84,638
94,297
21.4
22.3
24.5
27.1
13.5
12.2
5.6
5.3
42.6
46.0
1.9
1.7
Hind. Zinc
Neutral
308
-
130,119
14,252
18,465
55.9
48.3
15.8
21.5
19.5
14.3
3.2
2.8
17.0
20.7
9.1
7.1
Hindalco
Neutral
180
-
37,257
107,899
112,095
7.4
8.2
9.2
13.0
19.6
13.9
0.9
0.9
4.8
6.6
0.9
0.8
JSW Steel
Neutral
185
-
44,791
53,201
58,779
16.1
16.2
130.6
153.7
1.4
1.2
0.2
0.2
14.0
14.4
1.6
1.4
NMDC
Neutral
144
-
45,687
6,643
7,284
44.4
47.7
7.1
7.7
20.3
18.8
1.8
1.7
8.8
9.2
4.6
4.2
SAIL
Neutral
60
-
24,904
47,528
53,738
(0.7)
2.1
(1.9)
2.6
23.2
0.7
0.6
(1.6)
3.9
1.4
1.2
Vedanta
Neutral
256
-
75,763
71,744
81,944
19.2
21.7
13.4
20.1
19.1
12.7
1.6
1.5
8.4
11.3
1.4
1.1
Tata Steel
Neutral
481
-
46,701
121,374
121,856
7.2
8.4
18.6
34.3
25.9
14.0
1.6
1.5
6.1
10.1
1.0
1.0
Oil & Gas
Cairn India
Neutral
281
-
52,741
9,127
10,632
4.3
20.6
8.8
11.7
32.0
24.0
1.0
1.0
3.3
4.2
7.2
6.0
GAIL
Neutral
517
-
65,517
56,220
65,198
9.3
10.1
27.1
33.3
19.1
15.5
1.7
1.6
9.3
10.7
1.4
1.1
ONGC
Neutral
194
-
249,542
137,222
152,563
15.0
21.8
19.5
24.1
10.0
8.1
0.9
0.8
8.5
10.1
2.1
1.9
Indian Oil Corp
Neutral
386
-
187,389
373,359
428,656
5.9
5.5
54.0
59.3
7.2
6.5
1.1
1.0
16.0
15.6
0.7
0.6
Reliance Industries
Neutral
1,239
-
401,785
301,963
358,039
12.1
12.6
87.7
101.7
14.1
12.2
1.5
1.3
10.7
11.3
1.8
1.5
Pharmaceuticals
Alembic Pharma
Neutral
577
-
10,878
3,483
4,083
20.2
21.4
24.3
30.4
23.8
19.0
5.4
4.3
25.5
25.3
3.1
2.5
Stock Watch
February 28, 2017
Company Name
Reco
CMP
Target
Mkt Cap
Sales ( Čcr )
OPM(%)
EPS (Č)
PER(x)
P/BV(x)
RoE(%)
EV/Sales(x)
(Č)
Price ( Č)
( Č cr )
FY17E
FY18E
FY17E
FY18E
FY17E
FY18E
FY17E
FY18E
FY17E
FY18E
FY17E
FY18E
FY17E
FY18E
Pharmaceuticals
Alkem Laboratories Ltd
Neutral
2,135
-
25,527
6,065
7,009
18.7
20.0
80.2
92.0
26.6
23.2
6.0
5.0
22.5
21.6
4.2
3.6
Aurobindo Pharma
Buy
679
877
39,733
15,720
18,078
23.7
23.7
41.4
47.3
16.4
14.4
4.3
3.3
29.6
26.1
2.8
2.4
Aventis*
Neutral
4,180
-
9,627
2,277
2,597
17.3
18.3
149.4
172.0
28.0
24.3
4.6
3.7
25.1
28.8
3.9
3.2
Cadila Healthcare
Neutral
437
-
44,758
10,429
12,318
17.7
21.6
13.1
19.2
33.4
22.8
7.0
5.5
22.8
27.1
4.3
3.6
Cipla
Sell
588
465
47,295
15,378
18,089
15.7
16.8
19.3
24.5
30.5
24.0
3.6
3.2
12.3
13.9
3.2
2.7
Dr Reddy's
Neutral
2,858
-
47,345
16,043
18,119
18.0
23.0
78.6
130.9
36.4
21.8
3.5
3.1
10.1
15.2
2.7
2.6
Dishman Pharma
Neutral
226
-
3,641
1,718
1,890
22.7
22.8
9.5
11.3
23.8
20.0
2.3
2.1
10.1
10.9
2.6
2.3
GSK Pharma*
Neutral
2,673
-
22,642
2,800
3,290
10.2
20.6
32.2
60.3
83.0
44.3
15.4
15.2
17.2
34.5
7.9
6.7
Indoco Remedies
Reduce
268
240
2,469
1,112
1,289
16.2
18.2
11.6
16.0
23.1
16.7
3.7
3.1
17.0
20.1
2.3
2.0
Ipca labs
Accumulate
563
613
7,105
3,258
3,747
12.8
15.3
12.1
19.2
46.5
29.3
2.9
2.7
6.4
9.5
2.3
2.0
Lupin
Buy
1,464
1,809
66,090
15,912
18,644
26.4
26.7
58.1
69.3
25.2
21.1
4.9
4.0
21.4
20.9
4.2
3.5
Sun Pharma
Buy
675
847
161,911
31,129
35,258
32.0
32.9
30.2
35.3
22.4
19.1
3.6
3.0
20.0
20.1
4.8
4.0
Power
Tata Power
Neutral
83
-
22,368
36,916
39,557
17.4
27.1
5.1
6.3
16.2
13.1
1.4
1.3
9.0
10.3
1.6
1.5
NTPC
Neutral
165
-
136,174
86,605
95,545
17.5
20.8
11.8
13.4
14.0
12.3
1.4
1.3
10.5
11.1
2.9
2.9
Power Grid
Buy
193
223
100,891
25,315
29,193
88.2
88.7
14.2
17.2
13.6
11.2
2.1
1.8
15.2
16.1
8.6
7.8
Real Estate
Prestige Estate
Buy
169
210
6,345
4,707
5,105
25.2
26.0
10.3
13.0
16.4
13.0
1.3
1.2
10.3
10.2
2.5
2.2
MLIFE
Buy
346
522
1,421
1,152
1,300
22.7
24.6
29.9
35.8
11.6
9.7
0.9
0.8
7.6
8.6
2.0
1.6
Telecom
Bharti Airtel
Neutral
356
-
142,188
105,086
114,808
34.5
34.7
12.2
16.4
29.2
21.7
2.0
1.8
6.8
8.4
2.3
2.0
Idea Cellular
Neutral
115
-
41,275
40,133
43,731
37.2
37.1
6.4
6.5
17.9
17.6
1.5
1.4
8.2
7.6
2.0
1.8
zOthers
Abbott India
Neutral
4,490
-
9,541
3,153
3,583
14.1
14.4
152.2
182.7
29.5
24.6
144.8
123.7
25.6
26.1
2.7
2.4
Asian Granito
Buy
281
351
844
1,060
1,169
12.2
12.5
12.7
15.9
22.2
17.7
2.1
1.9
9.5
10.7
1.1
1.0
Bajaj Electricals
Accumulate
257
295
2,601
4,801
5,351
5.7
6.2
10.4
13.7
24.7
18.8
3.1
2.7
12.4
14.5
0.5
0.5
Banco Products (India)
Neutral
201
-
1,436
1,353
1,471
12.3
12.4
14.5
16.3
13.9
12.3
19.1
17.2
14.5
14.6
1.0
107.4
Coffee Day Enterprises
Neutral
235
-
4,846
2,964
3,260
20.5
21.2
4.7
8.0
-
29.4
2.7
2.5
5.5
8.5
2.0
1.8
Ltd
Competent Automobiles Neutral
174
-
107
1,137
1,256
3.1
2.7
28.0
23.6
6.2
7.4
33.5
30.2
14.3
11.5
0.1
0.1
Elecon Engineering
Neutral
53
-
597
1,482
1,660
13.7
14.5
3.9
5.8
13.6
9.2
3.2
2.9
7.8
10.9
0.7
0.6
Finolex Cables
Neutral
438
-
6,703
2,883
3,115
12.0
12.1
14.2
18.6
30.9
23.6
16.4
14.4
15.8
14.6
2.0
1.8
Garware Wall Ropes
Neutral
682
-
1,493
863
928
15.1
15.2
36.4
39.4
18.7
17.3
3.4
2.9
17.5
15.9
1.6
1.5
Goodyear India*
Neutral
708
-
1,632
1,598
1,704
10.4
10.2
49.4
52.6
14.3
13.5
66.1
58.0
18.2
17.0
0.7
97.9
Stock Watch
February 28, 2017
Company Name
Reco
CMP
Target
Mkt Cap
Sales ( Čcr )
OPM(%)
EPS (Č)
PER(x)
P/BV(x)
RoE(%)
EV/Sales(x)
(Č)
Price ( Č)
( Č cr )
FY17E
FY18E
FY17E
FY18E
FY17E
FY18E
FY17E
FY18E
FY17E
FY18E
FY17E
FY18E
FY17E
FY18E
zOthers
Hitachi
Neutral
1,400
-
3,807
2,081
2,433
8.8
8.9
33.4
39.9
41.9
35.1
33.8
28.2
22.1
21.4
1.8
1.5
HSIL
Neutral
315
-
2,276
2,384
2,515
15.8
16.3
15.3
19.4
20.6
16.2
20.4
17.6
7.8
9.3
1.1
1.0
Interglobe Aviation
Neutral
866
-
31,289
21,122
26,005
14.5
27.6
110.7
132.1
7.8
6.6
46.8
33.4
168.5
201.1
1.5
1.1
Jyothy Laboratories
Neutral
373
-
6,781
1,440
2,052
11.5
13.0
8.5
10.0
43.9
37.3
10.6
9.9
18.6
19.3
5.0
3.5
Kirloskar Engines India
Neutral
352
-
5,089
2,554
2,800
9.9
10.0
10.5
12.1
33.5
29.1
14.0
13.2
10.7
11.7
1.6
1.5
Ltd
Linc Pen & Plastics
Neutral
263
-
388
382
420
9.3
9.5
13.5
15.7
19.5
16.7
3.3
2.9
17.1
17.3
1.1
1.0
M M Forgings
Neutral
464
-
560
546
608
20.4
20.7
41.3
48.7
11.3
9.5
63.6
56.3
16.6
17.0
0.9
0.8
Manpasand Bever.
Neutral
698
-
3,996
836
1,087
19.6
19.4
16.9
23.8
41.3
29.3
5.0
4.3
12.0
14.8
4.5
3.4
Mirza International
Buy
91
107
1,093
1,024
1,148
18.0
18.0
6.9
8.0
13.2
11.3
2.2
1.9
16.6
16.3
1.3
1.1
MT Educare
Neutral
95
-
379
366
417
17.7
18.2
9.4
10.8
10.2
8.8
2.3
2.0
22.2
22.3
0.9
0.8
Narayana Hrudaya
Neutral
322
-
6,570
1,873
2,166
11.5
11.7
2.6
4.0
121.6
81.1
7.5
6.7
6.1
8.3
3.6
3.1
Navkar Corporation
Buy
163
265
2,318
369
561
42.9
42.3
7.2
11.5
22.5
14.1
1.7
1.5
7.4
10.5
7.3
4.8
Navneet Education
Neutral
143
-
3,350
1,062
1,147
24.0
24.0
6.1
6.6
23.6
21.7
4.8
4.3
20.6
19.8
3.2
3.0
Nilkamal
Neutral
1,874
-
2,797
1,995
2,165
10.7
10.4
69.8
80.6
26.9
23.3
107.1
93.0
16.6
16.5
1.4
1.2
Page Industries
Neutral
14,149
-
15,782
2,450
3,124
20.1
17.6
299.0
310.0
47.3
45.6
315.1
240.6
47.1
87.5
6.5
5.1
Parag Milk Foods
Neutral
223
-
1,875
1,919
2,231
9.3
9.6
9.5
12.9
23.6
17.2
3.7
3.0
15.5
17.5
1.1
1.0
Quick Heal
Neutral
248
-
1,735
408
495
27.3
27.0
7.7
8.8
32.0
28.2
3.0
3.0
9.3
10.6
3.4
2.8
Radico Khaitan
Accumulate
134
147
1,779
1,667
1,824
13.0
13.2
6.7
8.2
20.1
16.3
1.8
1.7
9.0
10.2
1.5
1.3
Relaxo Footwears
Neutral
425
-
5,104
2,085
2,469
9.2
8.2
7.6
8.0
56.2
53.5
21.8
18.6
17.9
18.8
2.5
2.2
S H Kelkar & Co.
Neutral
300
-
4,342
1,036
1,160
15.1
15.0
6.1
7.2
49.2
41.8
5.3
4.8
10.7
11.5
4.1
3.6
Siyaram Silk Mills
Neutral
1,655
-
1,551
1,652
1,857
11.6
11.7
92.4
110.1
17.9
15.0
2.6
2.3
14.7
15.2
1.1
1.0
Styrolution ABS India*
Neutral
612
-
1,077
1,440
1,537
9.2
9.0
40.6
42.6
15.1
14.4
38.5
35.0
12.3
11.6
0.7
0.6
Surya Roshni
Neutral
187
-
819
3,342
3,625
7.8
7.5
17.3
19.8
10.8
9.5
20.5
16.5
10.5
10.8
0.5
0.5
Team Lease Serv.
Neutral
856
-
1,463
3,229
4,001
1.5
1.8
22.8
32.8
37.6
26.1
4.0
3.5
10.7
13.4
0.4
0.3
The Byke Hospitality
Neutral
176
-
704
287
384
20.5
20.5
7.6
10.7
23.1
16.4
4.8
3.9
20.7
23.5
2.5
1.8
Transport Corporation of
Neutral
203
-
1,558
2,671
2,911
8.5
8.8
13.9
15.7
14.7
13.0
2.0
1.8
13.7
13.8
0.7
0.6
India
TVS Srichakra
Neutral
3,038
-
2,326
2,304
2,614
13.7
13.8
231.1
266.6
13.1
11.4
341.3
268.8
33.9
29.3
1.0
0.9
UFO Moviez
Neutral
406
-
1,122
619
685
33.2
33.4
30.0
34.9
13.6
11.7
1.9
1.6
13.8
13.9
1.5
1.2
Visaka Industries
Neutral
234
-
371
1,051
1,138
10.3
10.4
21.0
23.1
11.1
10.1
30.0
28.0
9.0
9.2
0.6
0.6
Stock Watch
February 28, 2017
Company Name
Reco
CMP
Target Mkt Cap
Sales ( Čcr )
OPM(%)
EPS (Č)
PER(x)
P/BV(x)
RoE(%)
EV/Sales(x)
(Č)
Price ( Č)
( Č cr )
FY17E FY18E FY17E FY18E FY17E FY18E FY17E FY18E FY17E FY18E FY17E FY18E FY17E FY18E
zOthers
VRL Logistics
Neutral
290
-
2,647
1,902
2,119
16.7
16.6
14.6
16.8
19.9
17.2
4.4
3.8
21.9
22.2
1.5
1.3
Wonderla Holidays
Neutral
374
-
2,112
287
355
38.0
40.0
11.3
14.2
33.1
26.3
4.7
4.1
21.4
23.9
7.0
5.7
Source: Company, Angel Research; Note: *December year end; #September year end; &October year end; Price as on February 27, 2017
Market Outlook
February 28, 2017
Research Team Tel: 022 - 39357800
DISCLAIMER
Angel Broking Private Limited (hereinafter referred to as “Angel”) is a registered Member of National Stock Exchange of India
Limited,Bombay Stock Exchange Limited and Metropolitan Stock Exchange Limited. It is also registered as a Depository Participant with
CDSL and Portfolio Manager with SEBI. It also has registration with AMFI as a Mutual Fund Distributor. Angel Broking Private Limited is a
registered entity with SEBI for Research Analyst in terms of SEBI (Research Analyst) Regulations, 2014 vide registration number
INH000000164. Angel or its associates has not been debarred/ suspended by SEBI or any other regulatory authority for accessing
/dealing in securities Market. Angel or its associates/analyst has not received any compensation / managed or
co-managed public offering of securities of the company covered by Analyst during the past twelve months.
This document is solely for the personal information of the recipient, and must not be singularly used as the basis of any investment
decision. Nothing in this document should be construed as investment or financial advice. Each recipient of this document should make
such investigations as they deem necessary to arrive at an independent evaluation of an investment in the securities of the companies
referred to in this document (including the merits and risks involved), and should consult their own advisors to determine the merits and
risks of such an investment.
Reports based on technical and derivative analysis center on studying charts of a stock's price movement, outstanding positions and
trading volume, as opposed to focusing on a company's fundamentals and, as such, may not match with a report on a company's
fundamentals. Investors are advised to refer the Fundamental and Technical Research Reports available on our website to evaluate the
contrary view, if any.
The information in this document has been printed on the basis of publicly available information, internal data and other reliable
sources believed to be true, but we do not represent that it is accurate or complete and it should not be relied on as such, as this
document is for general guidance only. Angel Broking Pvt. Limited or any of its affiliates/ group companies shall not be in any way
responsible for any loss or damage that may arise to any person from any inadvertent error in the information contained in this report.
Angel Broking Pvt. Limited has not independently verified all the information contained within this document. Accordingly, we cannot
testify, nor make any representation or warranty, express or implied, to the accuracy, contents or data contained within this document.
While Angel Broking Pvt. Limited endeavors to update on a reasonable basis the information discussed in this material, there may be
regulatory, compliance, or other reasons that prevent us from doing so.
This document is being supplied to you solely for your information, and its contents, information or data may not be reproduced,
redistributed or passed on, directly or indirectly.
Neither Angel Broking Pvt. Limited, nor its directors, employees or affiliates shall be liable for any loss or damage that may arise from
or in connection with the use of this information.